The Chart Data tab provides the ability to view and update the data columns of charts.
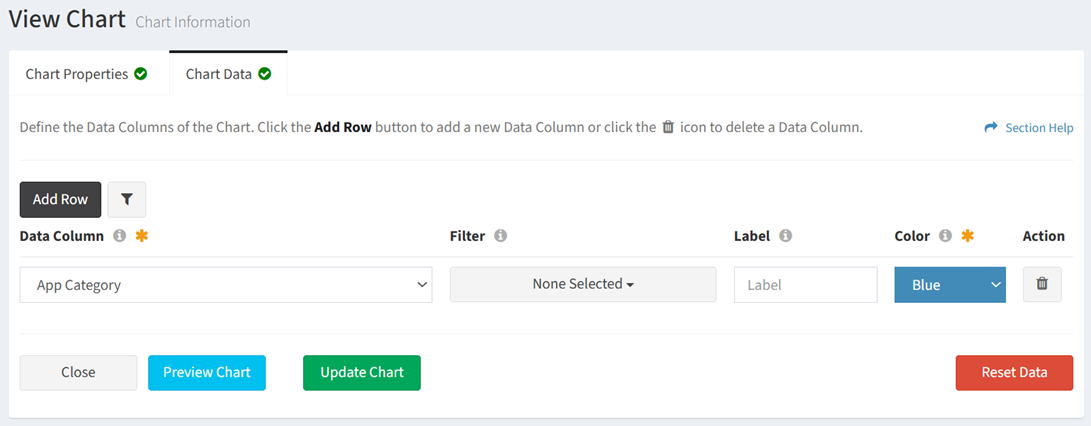
Available operations:
- View and update the data columns and filters of the chart (not a separate view and edit page)
- Fields available (view/edit)
- Data Column – Name of the data column (required)
- Filter – Name of the value to filter for the data column (optional)
- Label – Name of the data column in the chart legend (optional)
- Color – Color of the data column on the chart (i.e. slice of the pie, bar, area line) (required)
- Action – Delete a data column from the chart
- Add Row – Add new rows for additional data columns
- X-Axis (required for bar and area charts, not applicable to pie charts)
- Data Column – Name of the x-axis data column (required)
- Filter – Name of the value to filter for the x-axis data column (required)
- Color – Color of the data column on the x-axis
- Label (required for value data method, not applicable to sum data method)
- Data Column – Name of the label data column (required)
- Filter – Name of the value to filter for the label data column (required)
- Color – Color of the data column on the label
- Secondary Filter (optional)
- Show/Hide Secondary Filter – Show or hide the secondary filter
- Clear Secondary Filter – Clear the secondary filter
- Column Name – Name of the secondary data column (required for secondary filter)
- Filter – Name of the value to filter for the secondary data column (required for secondary filter)
- ADD Rule – Add more secondary filters
- Click the Reset Data button to clear all data columns
- Click the Update Chart button to save any changes to the properties
- Click the Preview Chart button to preview any changes to the properties
- Click the Close button to exit the wizard
NOTE: Changes to the properties of a chart require the cache to be cleared for the changes to appear on the dashboard.