The Charts tab provides the ability to manage charts.
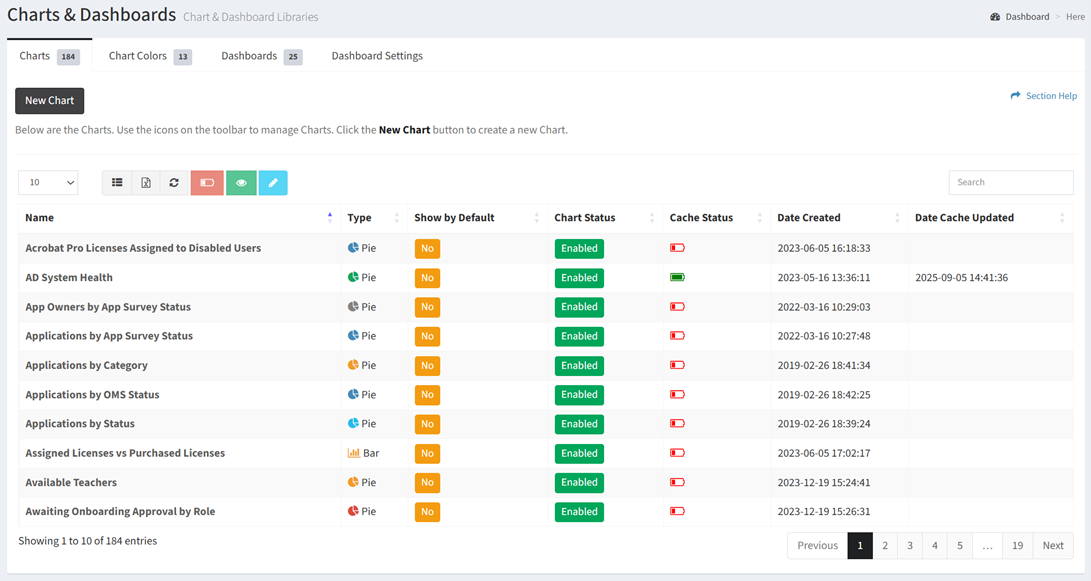
Available operations:
- Create new charts by clicking on the New Chart button
- View a list of charts in ReadyWorks
- Columns available
- Id (hidden by default) – ReadyWorks system Id of the chart
- Name – Name of the chart
- Type – Type of the chart (Pie, Bar, Area)
- Show by Default – Whether the chart is displayed by default on a ReadyWorks user’s dashboard
- Chart Status – Whether the chart is enabled or disabled
- Heading Color (hidden by default) – Color of the heading bar on the chart
- Cache Status – Status of the chart cache (
 ,
 )
- Date Created – Date the chart was created
- Date Cache Update – Date the chart cache was updated
- View the properties of charts by clicking the hyperlink of the Name field
- Preview charts by selecting a chart (row) and clicking the Preview Chart button on the toolbar
- Clear the cache of charts by selecting a chart (row) and clicking the Clear Cache button on the toolbar
- Delete charts by selecting a chart (row) and clicking the Delete Chart button on the toolbar
- You can also change the number of visible rows in the table, set column visibility, export to CSV or Excel, refresh the table, and search for text
In this section