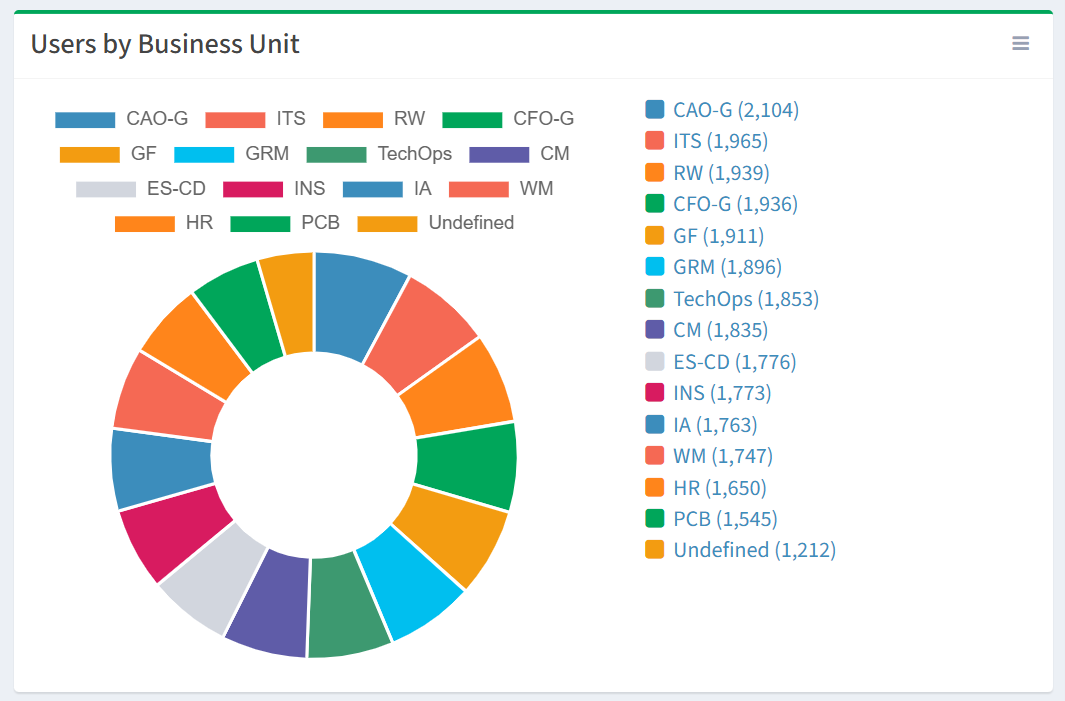
The Limit Results to Show setting is used to limit the number of results shown on a chart. In the example below, we are creating a pie chart to represent Users by Business Unit. This setting allows you to display all or a specific number of Business Units on a chart.
From the Charts tab, you can create charts and limit the results shown. To create:
- Click the New Chart button to bring up the New Chart wizard
- Enter the properties of the new chart
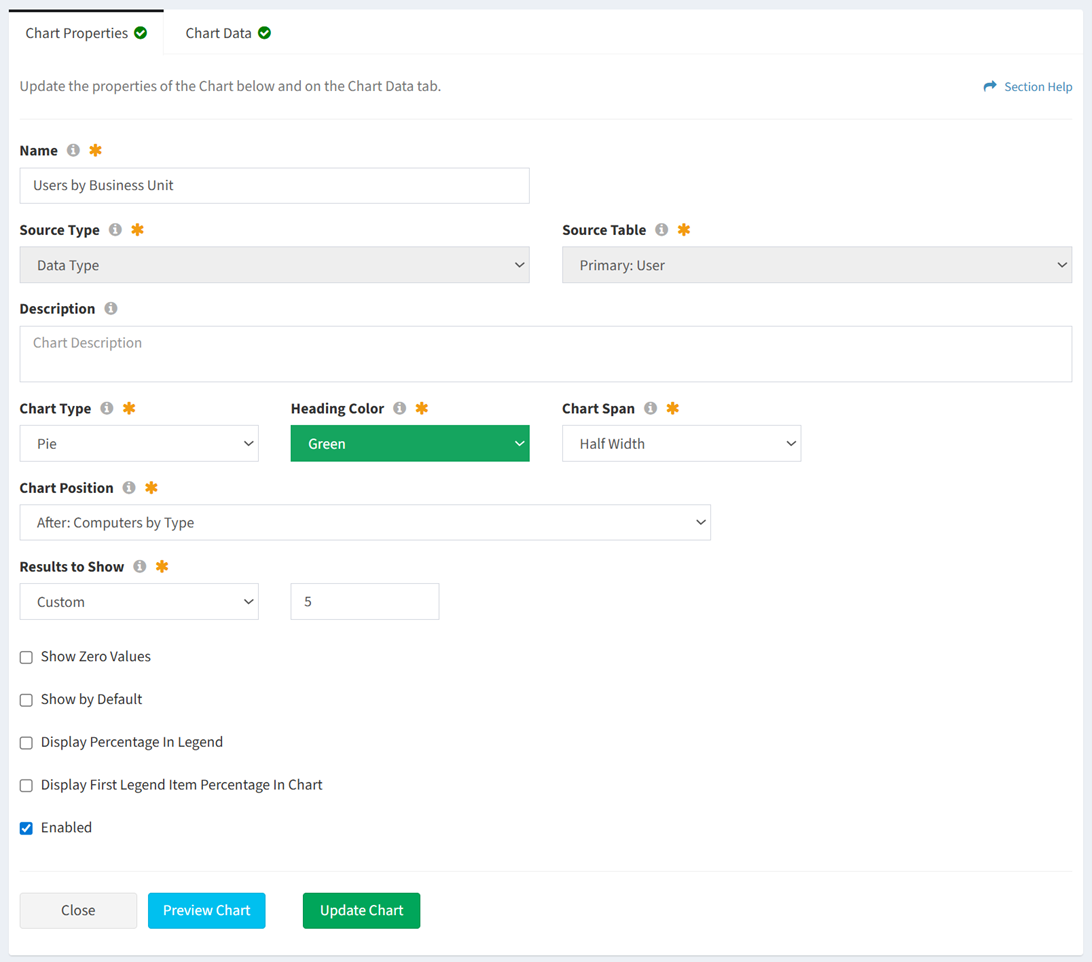
- Name – Users by Business Unit
- Source Type – Data Type
- Source Table – Primary: User
- Description – This field was left blank
- Chart Type – Pie
- Heading Color – Green
- Chart Span – Half Width
- Chart Position – After: Computers by Type
- Results to Show – Custom (5)
- Show Zero Values – NO. This will omit all zero values from the chart legend.
- Show by Default – YES
- Display Percentage In Legend – NO
- Display First Legend Item Percentage In Chart – NO
- Enabled – YES
- Select the data columns and filters of the new chart
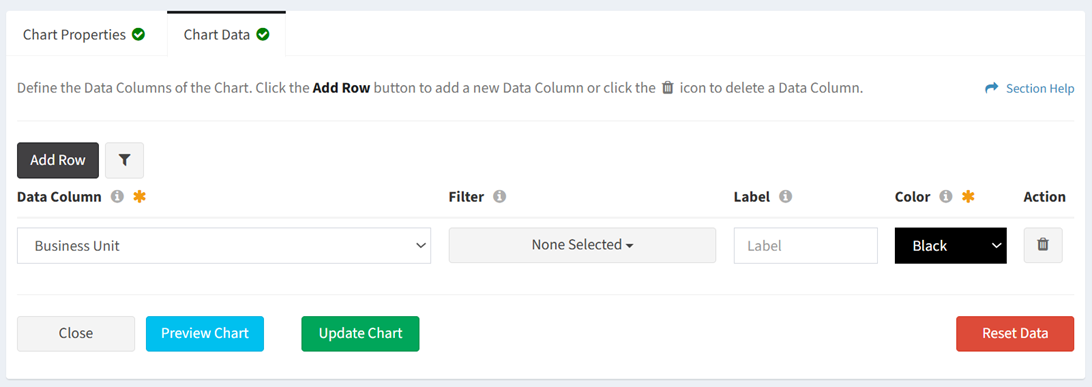
- Data Column – Business Unit
- Filter – None selected. This will display all Business Unit values on the chart.
- Label – The label was left blank. The field is ignored unless one or more filter values are selected.
- Color – Black. The field is ignored unless one or more filter values is selected.
- Secondary Filter – Not applicable for this example
- Click the Preview Chart button to preview the chart before saving. Click the Close button to exit the chart preview.
- Click the Create Chart button when finished to create the chart. You will be redirected back to the Charts tab. Click the Cancel button to cancel the operation.
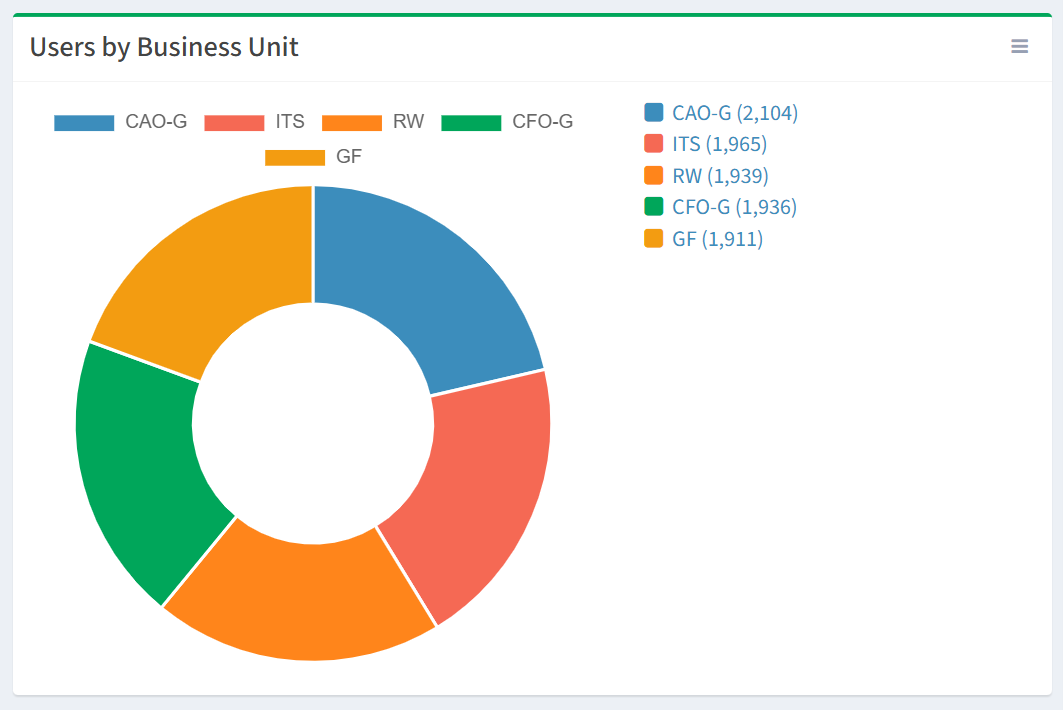
- The Users by Business Unit pie chart with Results to Show set to CUSTOM (5) is shown below. The top five Business Units are displayed on the chart.
- The Users by Business Unit pie chart with Results to Show set to ALL is shown below. All Business Units are displayed on the chart.