From the Charts tab, you can create charts. To create:
- Click the New Chart button to bring up the New Chart wizard
- Enter the properties of the new chart
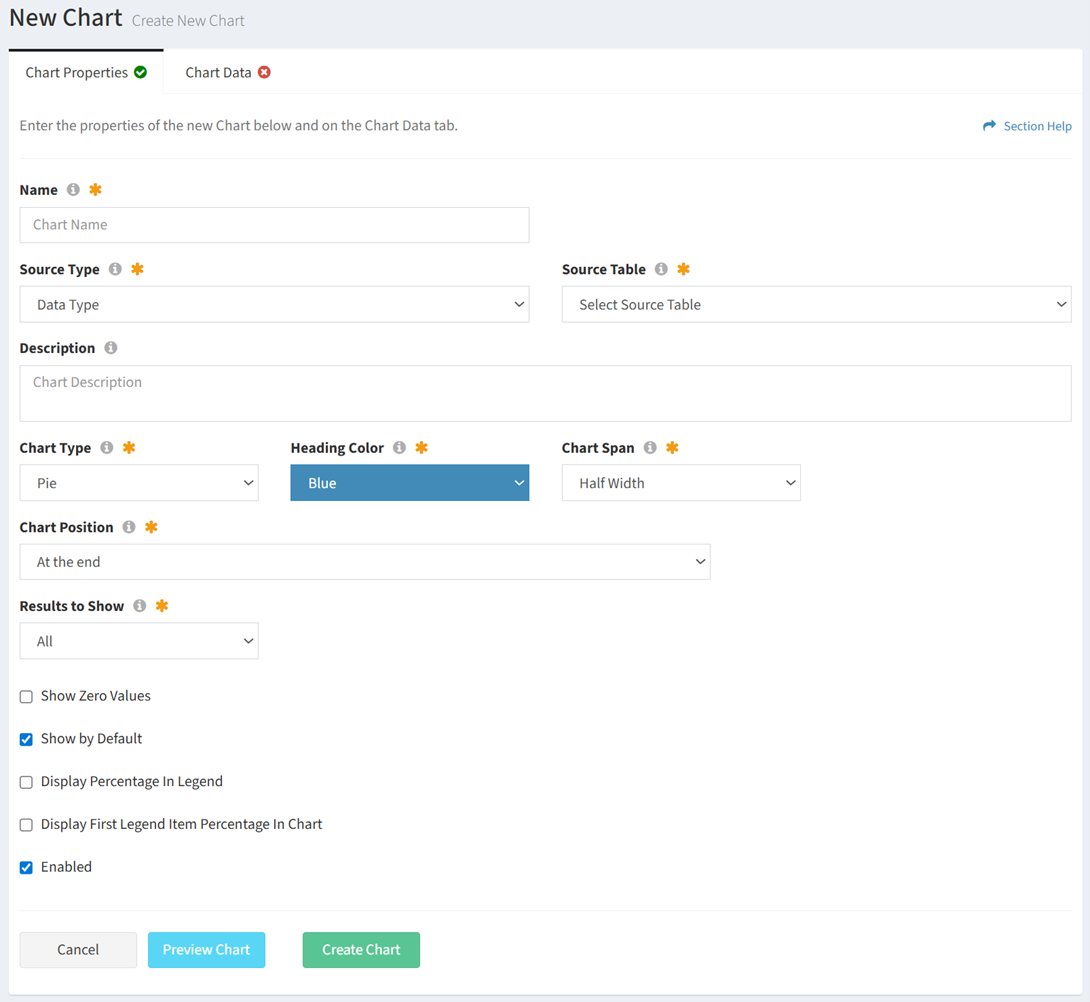
- Name – Name of the chart (required)
- Source Type – Type of the source data table for the chart (required)
- Different options are available depending on the type of source:
- Data Type – Use a data type (primary or secondary) as the source for the chart

- Source Table – Name of the source data type for the chart (required)
- Report – Use a report as the source for the chart

- Source Report – Name of the source report for the chart (required)
- Data Method – Data method of the chart (Sum or Value) (optional)
- Sum – Total for each value in a data column (e.g., Computers in New York)
NOTE: Sum is the data method used when Data Type is selected as the Source Type. - Value – Value in a data field (e.g., Annual Cost of HR Software)
- Legend Number Format – Choose if chart legend values are formatted as numbers (e.g., 1,000.00) (optional)
- Legend Leading Character – Enter character to prepend to chart legend values (e.g., $) (optional)
- Description – Description of the chart (optional)
- Chart Type – Type of the chart (Pie, Bar, Area) (required)
- Index Axis – Index axis of the chart (Vertical, Horizontal) (required)
NOTE: Only available on Bar charts. - Heading Color – Color of the heading bar on the chart (only default colors are available from the drop down) (required)
- Chart Span – Spanning of the chart on the dashboard (Half Width, Full Width) (required)
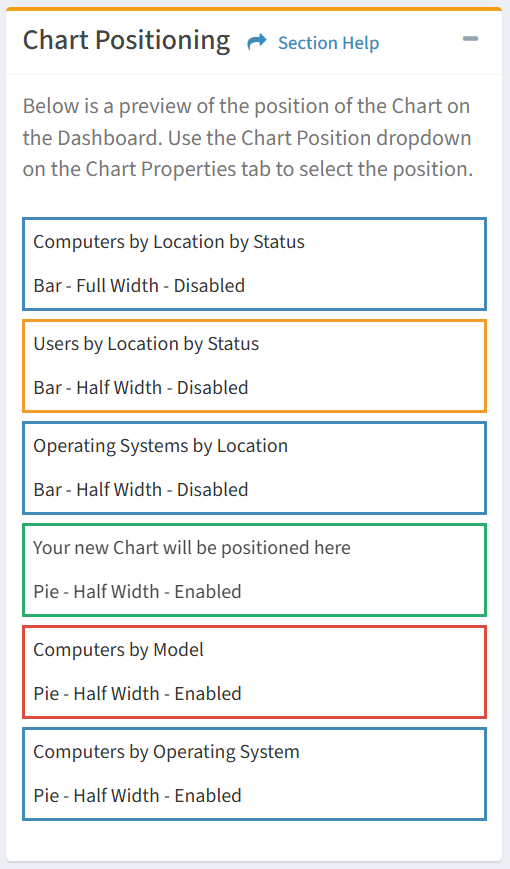
- Chart Position – Select the chart this chart will display before or after. The chart position is displayed on the right side of the wizard. (required)
- Results to Show – Choose to show all results or limit to a number (e.g. show the top five values) (required)
- Show Legend – Choose if the legend is displayed on the chart (optional)
NOTE: Only available on Bar and Area charts. - Show Zero Values – Choose if items with zero values are displayed on the chart (e.g. No Computers with a particular Migration Status) (optional)
- Show by Default – Choose if the chart is displayed by default on a ReadyWorks user’s dashboard (optional)
- Display Percentage in Legend – Choose if percentages are displayed in the chart legend (optional)
NOTE: Only available on Pie charts. - Display First Legend Item Percentage in Chart – Choose if the percentage of the first legend item is displayed in the center of the chart (optional)
NOTE: Only available on Pie charts. - Enabled – Choose if the chart is enabled (optional)
- Select the data columns and filters of the new chart
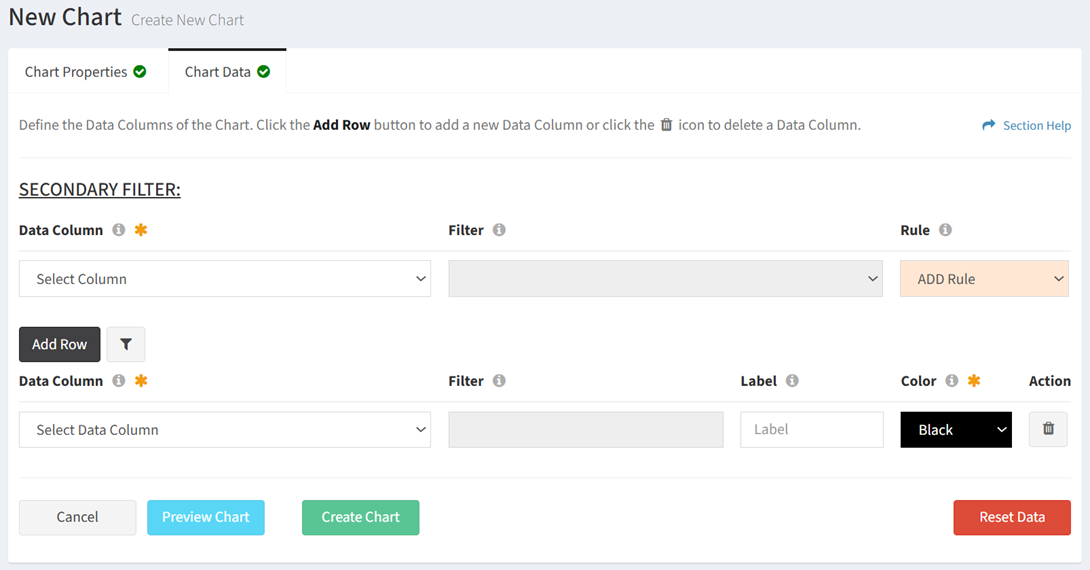
- Data Column – Name of the data column (required)
- Filter – Name of the value to filter for the data column (optional)
- Label – Name of the data column in the chart legend (optional)
- Color – Color of the data column on the chart (required) (i.e. slice of the pie, bar, area line)
- Action – Delete a data column from the chart
- Add Row – Add new rows for additional data columns
- X-Axis (required for bar and area charts, not applicable to pie charts)
- Data Column – Name of the x-axis data column (required)
- Filter – Name of the value to filter for the x-axis data column (required)
- Color – Color of the data column on the x-axis
- Label (required for value data method, not applicable to sum data method)
- Data Column – Name of the label data column (required)
- Filter – Name of the value to filter for the label data column (required)
- Color – Color of the data column on the label
- Secondary Filter (optional)
- Show/Hide Secondary Filter – Show or hide the secondary filter
- Clear Secondary Filter – Clear the secondary filter
- Column Name – Name of the secondary data column (required for secondary filter)
- Filter – Name of the value to filter for the secondary data column (required for secondary filter)
- ADD Rule – Add more secondary filters
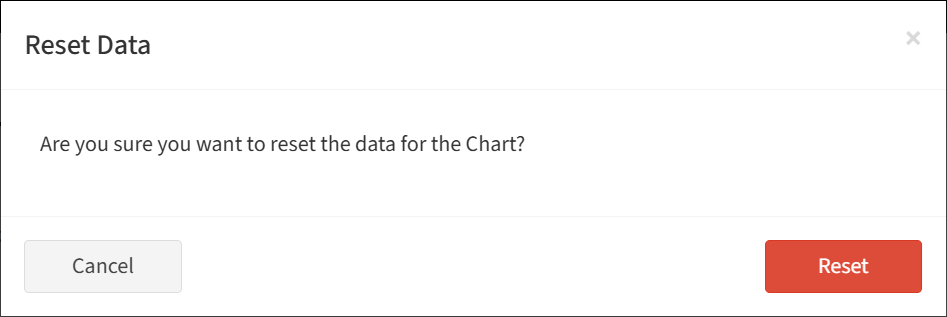
- Click the Reset Data button to clear all data columns. Click the Reset button to confirm the reset operation. Click the Cancel button to cancel the operation.
- Click the Preview Chart button to preview the chart before saving. Click the Close button to exit the chart preview.
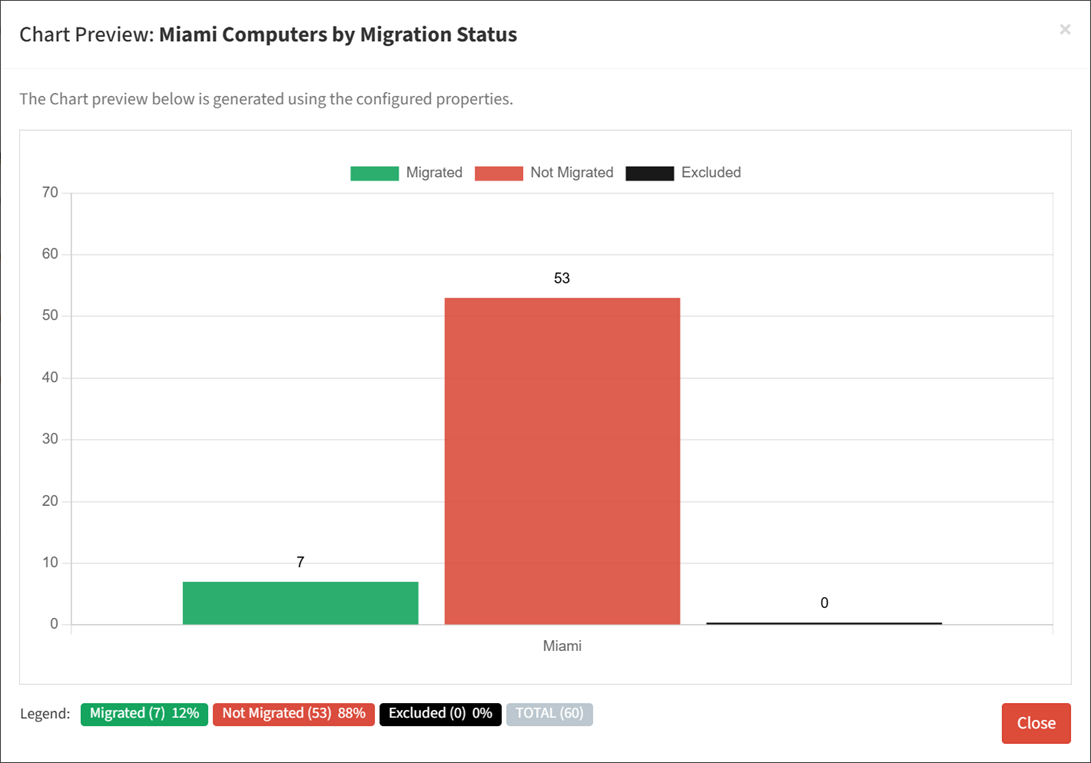
- Strikethrough a data column to temporarily hide it from the chart preview

- Click the Create Chart button when finished to create the chart. You will be redirected back to the Charts tab. Click the Cancel button to cancel the operation.